
Solahart are in a unique position to help solve the Solar Duck curve as we are one of the very limited companies that offer Solar Power, Batteries and Solar Hot Water and the only company that offers a smart water heater.
In South Australia we have been working with Premier Steven Marshall and the SA Government to eliminate the Solar Duck Curve by installing our exclusive PowerStore smart hot water units.
These systems use the excess solar power during the day to heat your water just like a battery while being more affordable.
The article from Renew Economy below explains exactly how this works and how batteries or our PowerStore helps.
By Paul McCormick 24 December 2020
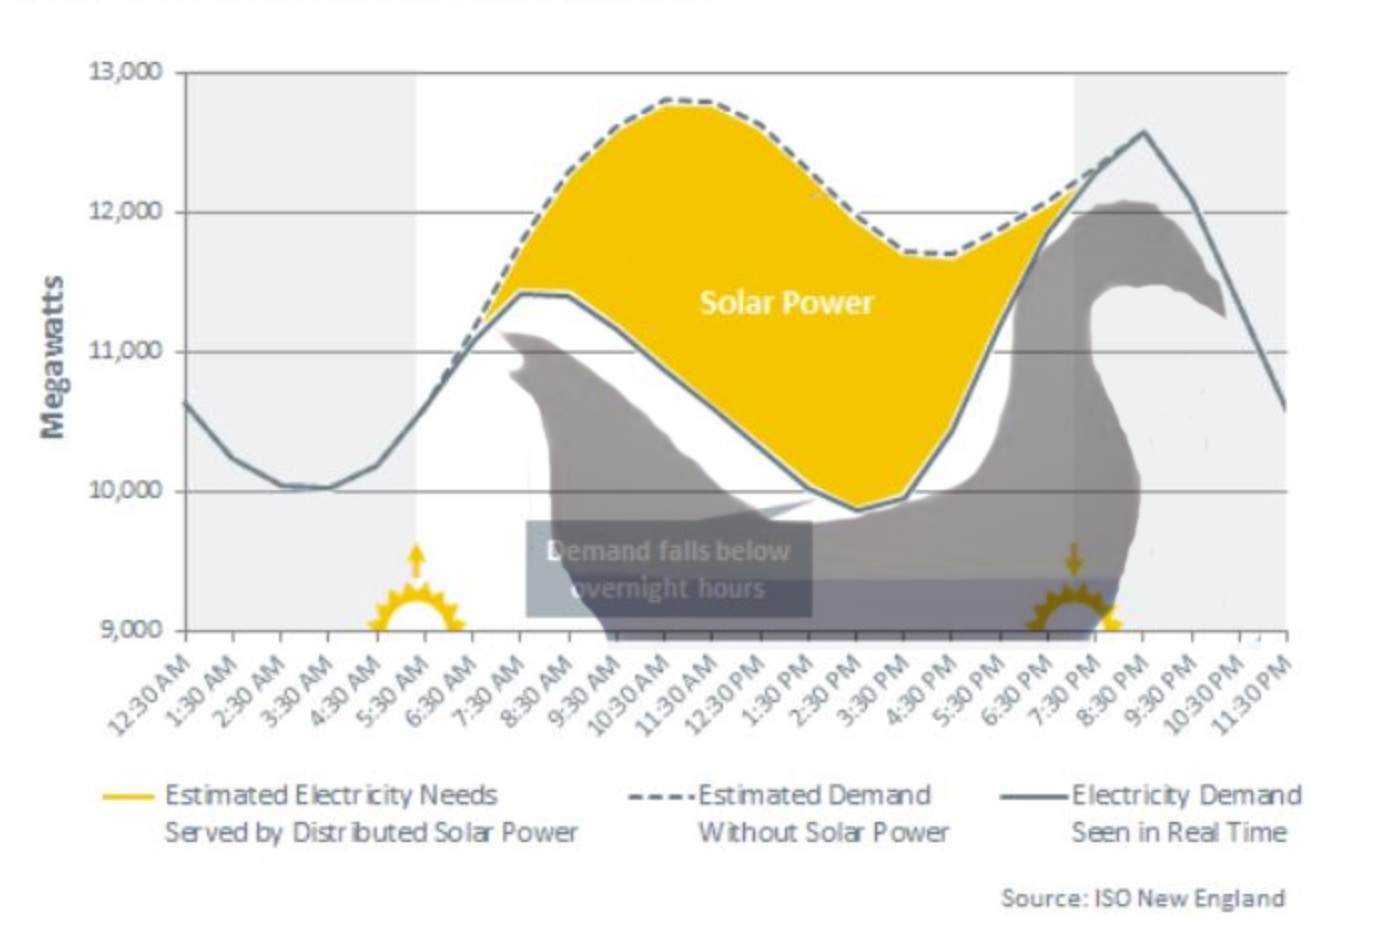
The continued rapid growth of PV rooftop solar in Australia and elsewhere in displacing fossil fuel generation of electricity is becoming a significant issue.
The energy imbalance from increasing rooftop solar is causing a reduction of daytime operational power demand during the day to the level where grid stability issues occur on clear days when the rapid decrease in rooftop power in the late afternoon as the sun sets requires a rapid ramp up of the output from conventional fossil fuel generators.
The problem is exacerbated by the increase in evening household power demand. The simple bottom-up solution to the duck curve problem is to add battery storage to individual household solar systems to level out the net power curve. This solution is well known and often alluded to.
However, little detail is available to evaluate options and enable decisions to be made. Here, the results of a study aimed at establishing the effect of household batteries on home and grid energy performance are discussed.
Fig 1 illustrates the problem at the level of a single household. Fig 1 curve (a) shows a typical daily household load profile. Australian households use about 20 kWh of electricity per day, with load peaks in the morning and late afternoon/evening. Minimal usage occurs during daytime and late night hours.
Curve (b) of Fig. 1 shows our calculation of the solar power supplied to the house by a 4 kWp rooftop solar array on a clear spring day in Perth, WA. The solar power peaks at midday and when little use is made of the available power.
Only 38% of the available solar energy is utilized by the household over this clear full day due to the mismatch of the load and supply profiles. Power that exceeds the load during the day is assumed to be exported to the grid.

Curve (c) of Fig 1 shows the net power flow to and from the house (negative values are exported power). This is the single household equivalent of the Duck curve. The exported solar power during mid-day reduces in the operational demand of the grid.
The increase in net power starting in the afternoon is due to the reduction of rooftop solar as well as to the increase in household load. Household energy supply and demand are out of phase and so the grid is required to provide backup energy in the afternoon to meet the increasing load.
The effect of adding a 10 kWh battery to household energy flows is shown in Fig 2 curve (b).
The energy stored during the day reduces the export energy by more than 60%, from 17.5 kWh to 7.5 kWh. This energy meets the evening load, increasing household solar self-sufficiency for the day from 38 % to 82%.
As shown in Fig. 2 curve (c), adding a further 10 kWh storage (20 kWh total) completely flattens the curve, making the house energy autonomous on this day. In addition 4 kWh of energy remains in the battery available for export to the grid at 8 pm.

In Fig 3 the household energy flows shown in Fig 2 are put into context of grid power flows in Western Australia [4]. Fig 3(a) shows the operational and underlying power demand curves for the week of 20-24 October 2020 [4].
The operational demand curve includes all forms of electricity generation with the exception of rooftop solar. All days are clear with peak power demands of ~2500 MW. Rooftop solar supplies ~1,100 MW power at midday on clear days, equal to about 45% of peak demand.
As shown in Fig. 2, the peak export power flow from a single household with a 4 KWp rooftop array is ~ -3 kW at noon. This may seem like a very small number when compared to grid power levels.
However, when summed over Power (kW) the number of houses in WA with rooftop solar and connected to the grid it is significant. In WA rooftop solar is the single largest generator of grid electricity.
It is estimated that ~33% of the ~ 1.1 million houses in the state have rooftop solar. If each of these houses exports 3 kW to the grid at noon the total is ~1.1 GW, in good agreement with AEMO data.
As shown in Fig 3(a), the supply of rooftop solar rapidly goes to zero during the late afternoon. This power loss must be made up for, as well as meeting the increased evening load peak, by rapidly increasing available dispatchable power.

Fig 3a WA Power generation for October 20 – 24
Fig 3b shows the effect of adding 10 kWh storage to each household with rooftop solar. Comparison with Fig 3a shows that addition of the storage reduces the rooftop solar energy supplied to the grid from 57.2 GWh to only 7.5 GWh, an average daily 87% decrease.
This energy is stored and used to meet the evening household load demand after 3:00 pm.
As a consequence, the daily grid power ramp up required to meet the afternoon load is reduced from ~1050 MW to ~460 MW, a 56% reduction.
Increasing the storage capacity to 20 kWh completely removes the grid energy supplied by rooftop solar on these days as shown in Fig 3c. With 20 kWh storage all rooftop solar is self-consumed. This energy transfer occurs behind the meter.

Fig 3b Effect of adding 10 kWh battery to each household.
Strategies currently being trialed to address grid instabilities caused by intermittent rooftop PV are mainly top down and focused on increasing grid stability by limiting and controlling rooftop and utility solar power generation.
Examples include restricting the output from solar farms, reducing or even eliminating FITs,, limiting the size of household inverters and employing big batteries. The addition of big batteries to the grid has been shown to solve stability issues.
Nearly all big batteries installed or proposed are for providing frequency control or buffering against short-term voltage fluctuations. These problems, caused by the decrease in operational demand during the day, should disappear with household battery storage, minimizing household export to the grid as well as household load demand.
The simple bottom-up process of adding household batteries to existing and new rooftop solar systems not only significantly increases solar self- consumption, but also minimizes transmission and infrastructure costs.
Since the batteries are added behind the meter no extra infrastructure is needed. Rapid implementation should be possible. At the grid level all that will be evident is a reduction and levelling out of household power demand over the day.
Since the Duck problem originates on the rooftops of individual households, it makes sense to solve the problem there, behind the meter.
This is particularly true now that the costs of household batteries have decreased to less than big batteries.
Credit: Paul McCormick & Renew Economy